Monitoring Melissa and analyzing your results
This tutorial provides the user with information on how to efficiently monitor a Melissa study during and after execution.
Melissa Logs
In the current version of Melissa, each component (i.e. launcher, server, clients) has its own log file(s) written in the output directory of the study:
melissa_launcher.log- this file contains all information written by the launcher. It makes the user aware of any client/server job failure and whether the whole study was successful or not. The level of verbosity of this log is set with theverbosityoption in thelauncher_configsection of the configuration file.melissa_server_<rank>.log- this file is generated for each rank of the server. It makes the user aware of any problem occurring in the processing of the clients data. This level of verbosity of these logs is set with theverbosityoption in thestudy_optionssection of the configuration file.- client logs - these correspond to the standard output/error of the client jobs. Their name depend on the scheduler and their
uid(see Launching and debugging a use-case). Besides the potential error messages resulting from a client execution, the error output contains information printed by the Melissa API. On the other hand, the standard output contains information produced by the data generator.
Note
All standard output/error files are saved in the stdout folder located inside the output directory of the study.
In addition to these files, the deep-learning server writes all training related information to a tensorboard log. This one is discussed at the end of this page.
Job monitoring on a cluster
Batch schedulers provide functions to monitor job progress. In OAR, there is a convenient command called oarstat -u. The user can monitor the status of all their jobs via:
On slurm, the user can use squeue --user=username in the command:
Note
The -n flag specifies the refresh frequency in seconds. This parameter helps keep the frontend from becoming saturated so that other users can use it without performance degradation.
Warning
It is sometimes recommended to use refresh frequency of the order of the minute.
Using the melissa-monitor command
melissa-launcher also provides a REST API (details here). melissa-monitor builds on the REST API to automatically plot the job statuses to the cluster terminal. To use this module, the user should first install the dependency pip3 install plotext. The user can start melissa-launcher as normally. They will notice a header printed to the terminal that looks like this:
user@flyon:~/melissa/melissa$ melissa-launcher --config_name config_oar_cpu

$! -------------------------------------------------$!
  __  __ ______ _      _____  _____ _____
 |  \/  |  ____| |    |_   _|/ ____/ ____|  /\
 | \  / | |__  | |      | | | (___| (___   /  \
 | |\/| |  __| | |      | |  \___ \\___ \ / /\ \
 | |  | | |____| |____ _| |_ ____) |___) / ____ \
 |_|  |_|______|______|_____|_____/_____/_/    \_\

$! -------------------------------------------------$!

Access the terminal-based Melissa monitor by opening a new terminal and executing:

melissa-monitor --http_bind=0.0.0.0 --http_port=8888 --http_token=I-2pqnkgVNfdR3U-wUiUbw --output_dir=/home/user/melissa/melissa/examples/lorenz/STUDY_OUT
The user can follow the provided instructions, by opening a new terminal, sourcing melissa_set_env.sh and pasting the recommended command. This will start continuous job status tracking with output that looks like this:
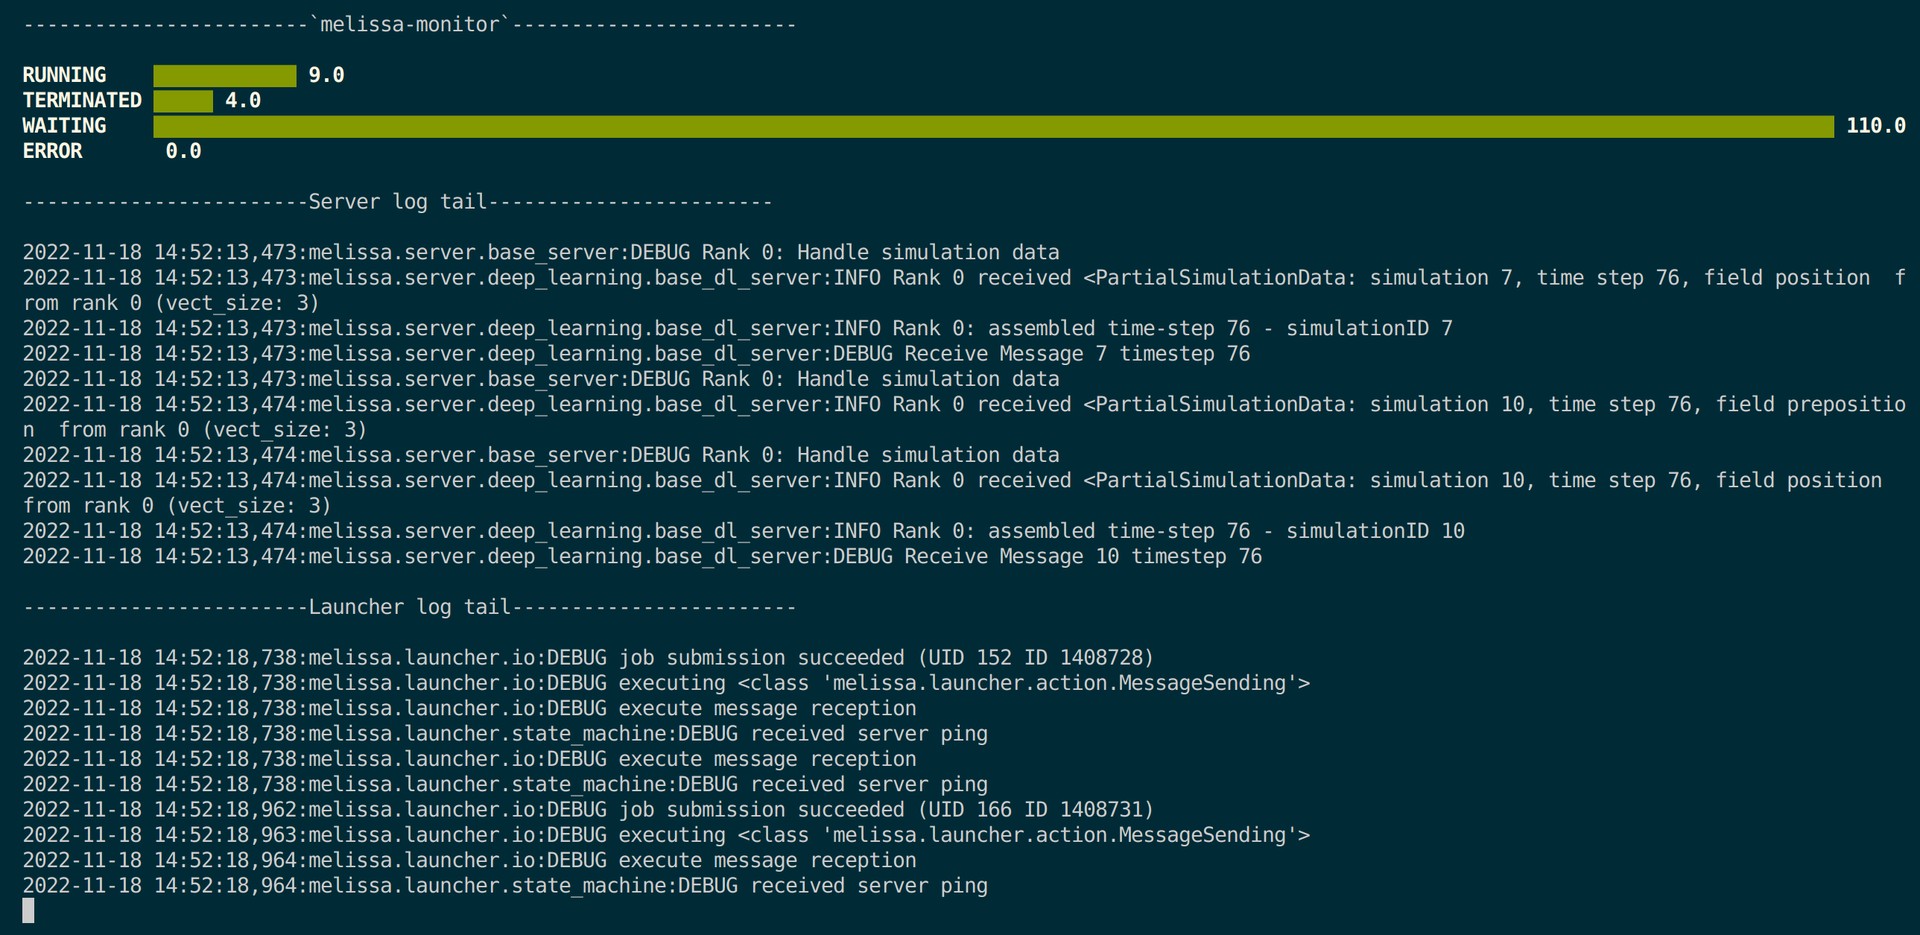
The default settings can be controlled in the launcher_config of the configuration json file. Available controls include: bind (default 0.0.0.0), http_port (default 8888), http_token (defaults to an automatically generated unique 16 char safe token):
    "launcher_config": {
        "scheduler": "oar",
        "num_server_processes": 1,
        "num_client_processes": 1,
        "bind": "0.0.0.0",
        "http_port": 8888,
        "http_token": "I-2pqnkgVNfdR3U-wUiUbw",
        "scheduler_arg_server": [
            "walltime=01:00:00"
        ],
        "fault_tolerance": false,
        "client_executable": "/path/to/melissa/examples/lorenz/lorenz.py",
        "verbosity": 1
    }
Note
If users are running on an EAR enabled cluster, they can activate real-time power monitoring (via eacct) with the --report_eacct_metrics flag.
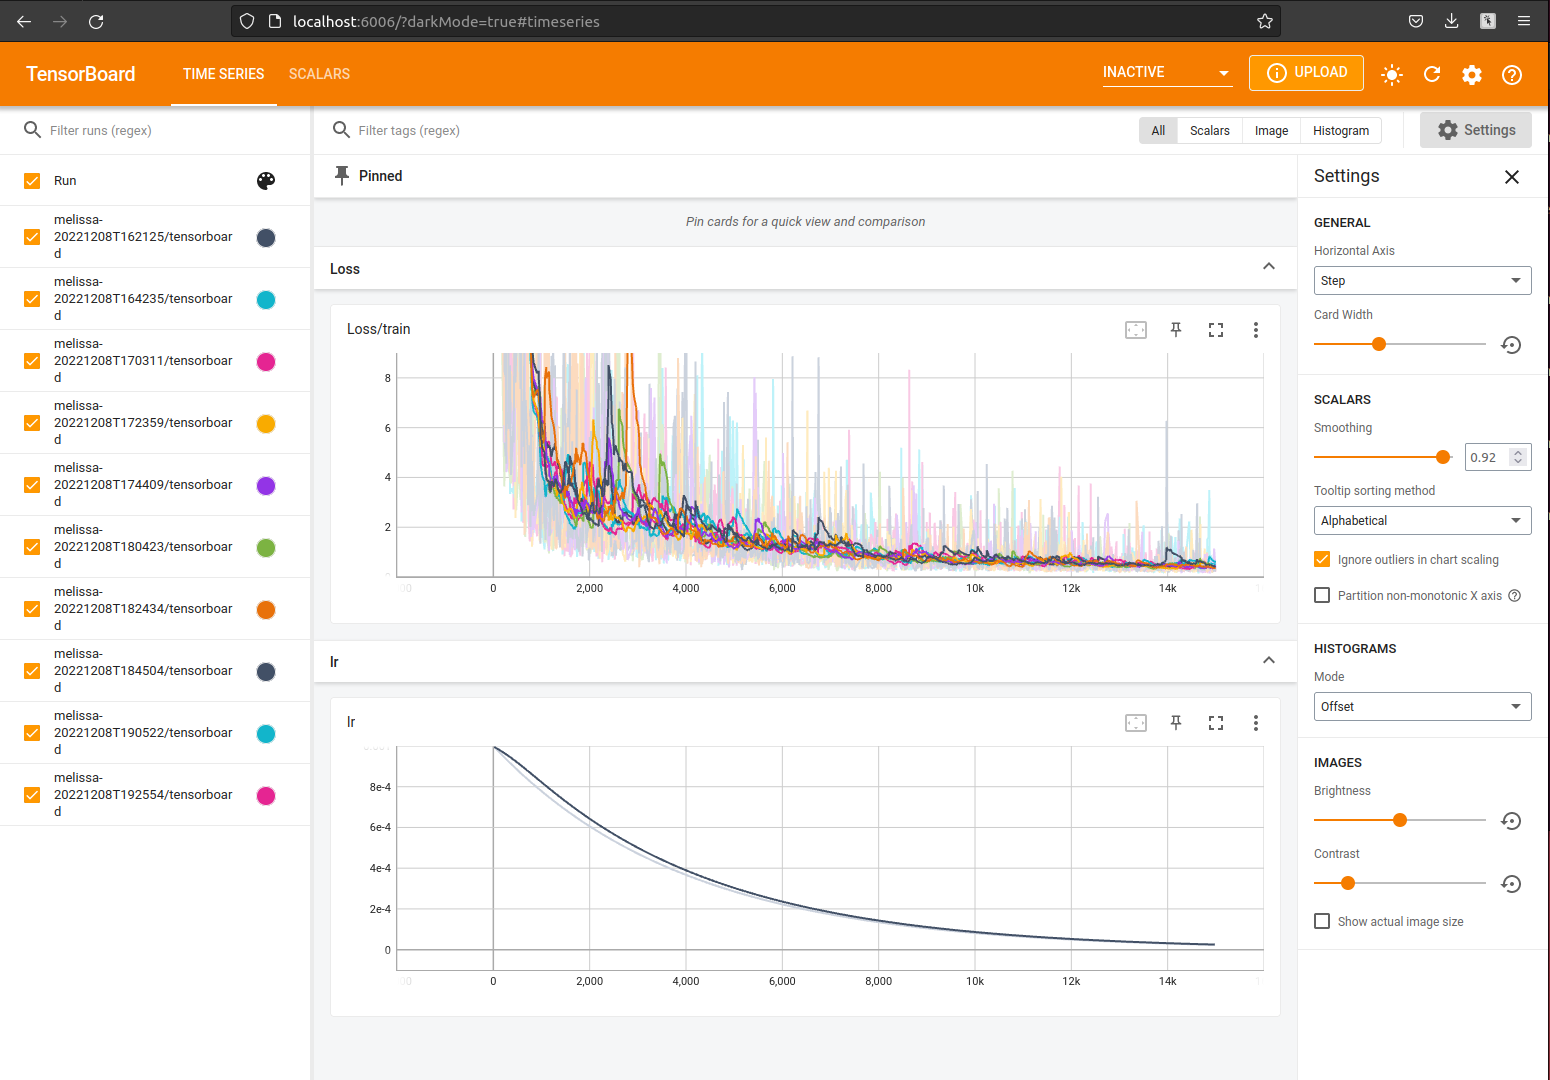
Tensorboard logging for Deep Learning
Users are encouraged to use the built in Tensorboard logging feature designed to help users more easily monitor and post-process their deep-learning studies. As exemplified in examples/heat-pde/heatpde_server.py, the Tensorboard logger is available anywhere in the custom server class under the method self.tb_logger.log_scalar. For example, the loss during training can be logged by embedding the following line inside the training loop:
Tensorboard makes it easy to monitor these values in real-time by opening another terminal and executing:
Which will start a server on the localhost at port 6006. Thus, typing http://localhost:6006 into a browser will open up the Tensorboard dashboard where users can monitor the training progress, as well as any additional data they chose to log using self.tb_logger.log_scalar:
Melissa makes use of the tensorboard logger for a variety of other metrics including:
-
samples_per_second: Average number of samples trained per second (loggedn_batch_updatefrequency). -
buffer_size: Size of the buffer at given time (logged on each sampleget). -
put_time: Time spent toputeach sample into the buffer. -
get_time: Time spent togeteach sample from the buffer. -
put_get_inc: Metric aimed at showing balance of puts and gets (puts add 1, gets subtract 1). -
buffer_std/{param}: The standard deviation of{param}in the buffer (only active ifget_buffer_statisticsis set to true indl_config). This value also requires customization for custom parameters (seeexamples/heat-pde/heat-pde-dl/heatpde_dl_server.pyfor an example. -
buffer_mean/{param}: The mean of{param}in the buffer (only active ifget_buffer_statisticsis set to true indl_config). This value also requires customization for custom parameters (seeexamples/heat-pde/heat-pde-dl/heatpde_dl_server.pyfor an example).
Deeper post-processing
Users have the option of automatically generating a pandas dataframe from the tensorboard logs via a configuration flag convert_log_to_df. By default, this flag is set to false, but when it is activated, it will save a dataframe pickle to the output_dir/tensorboard directory. The dataframe will contain all information logged by the function self.tb_logger.log_scalar() (including all additional metrics listed in Tensorboard logging).
The following is an example dl_config for users who wish to generate a dataframe from their Tensorboard logs:
Note
This function requires an additional installation of pandas and tensorflow, which can both be installed via pip with pip install pandas tensorflow
Users can then access each individual metric using pandas filtering mechanisms such as:
import pandas as pd
import matplotlib.pyplot as plt

df = pd.read_pickle("data.pkl")

puts = df[df.name == "put_time"]
gets = df[df.name == "get_time"]
buffer = df[df.name == "buffer_size"]

fig, ax = plt.subplots()
ax2 = ax.twinx()

ax.plot(puts["step"], puts["value"], alpha=0.5, label="puts", color="tab:blue")
ax.plot(gets["step"], gets["value"], alpha=0.5, label="gets", color="tab:orange")
ax2.plot(buffer["step"], buffer["value"], alpha=0.5, label="put get metric", color="tab:red")

ax.set_yscale("log")
ax.set_ylabel("Time (s)")
ax2.set_ylabel("Buffer size (N)")
ax.set_xlabel("Sample number")
ax.legend(loc="upper left")
ax2.legend(loc="upper right")
plt.savefig("puts_gets.png")
Using the Melissa REST API
The melissa-launcher includes a REST API for tracking job statuses. The base URL is by default the local host (accepting exterior connections) on port 8888:
But the host URL can be easily controlled in the launcher_config with the bind parameter. Similarly, the port number can be changed using the http_port parameter in the launcher_config.
melissa-launcher supports two endpoints, /jobs and /jobs/<job_number>. Where, /jobs returns a list of all job numbers known the the launcher. Meanwhile, /jobs/<job_number> returns specific job status of <job_number>, which may include WAITING, RUNNING, TERMINATED, and ERROR.
An example of how to use the REST API with the python requests library is provided in melissa/launcher/monitoring/terminal_monitor.py (details of script usage shown here). Namely, the job information can be retrieved with the following two commands:
import requests

# get the
response = requests.get(f'http://127.0.0.1:8888/jobs', headers={'token':'I-2pqnkgVNfdR3U-wUiUbw'}).json()

# response
# {'jobs': [0,1,2,3,4]}

job_dict = requests.get('http://127.0.0.1:8888/jobs/1', headers={'token':'I-2pqnkgVNfdR3U-wUiUbw'}).json()

# job_dict
# {
#   'id': 9995, # oarid
#   'unique_id': 1,
#   'state': 'RUNNING'
# }